What do you look at before taking any trade in options trading? It’s past, right? It is important that whenever it comes to options trading, one should always analyze its past performance, as this will give you an idea whether it will be right for you to take that trade or not.
Historical price charts prove to be very beneficial for traders. They tell us which strategies you can make in the future based on the past. But there will be some beginners among you who will have a lot of confusion about historical price charts. In this blog, we will try to clear that confusion.
Let’s dive right in!!
What Are Historical Price Charts?
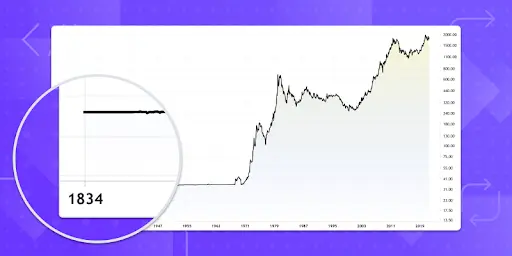
Historical price charts tell us about the life history of any stock or option so far. These charts show when a particular stock reached a high, when it fell low, and what its closing prices were during each trading period. Some historical charts also show trading volume, which helps you a lot in making your trading strategy.
By studying these charts, traders come to understand some patterns. Traders can find out where prices often bounce back and see where they usually face resistance. This type of study is called trend analysis, and it forms the foundation of technical trading.
Why Study Past Price Movements?
You cannot predict the future of any stock by looking at historical prices with your eyes closed. It tells you past prices in which some patterns are hidden; you just have to catch those patterns.
- Spot trends: Observations over time can show whether the market is rising (bullish) or falling (bearish). The information in this article might help you choose whether to ride the wave or wait for it to reverse course.
- Test strategies: Before risking real money, you can check how a trading idea would have worked in the past. If a strategy shows good results in different time periods, you may feel more confident using it.
- Plan entry and exit points: Highs and lows from the past often act as hurdles. These numbers help traders choose where to buy and sell.
Using Charts in Options Trading
If we talk about options and stocks, then options trading is comparatively complex because they are influenced by more than just price.
There are other things in options data besides price records, such as implied volatility, open interest, and time decay. All of these things have an effect on how a choice acts.
For example, whenever there is an announcement about a company’s earnings, you will notice that implied volatility always increases. By looking at historical charts, you learn how option prices reacted during similar events in the past. This helps you plan better trades instead of going in blind.
If you are just starting and want to learn to trade options, the best thing you can do is to use an options trading application that shows historical data, which can make things much easier.
What is Unusual Options Flow?
Unusual Options Flow happens when there is a sudden increase in volume or open interest on certain contracts compared to normal trading activity. This can be a sign that big traders or institutions are positioning for something important.
By reviewing historical flow, you can see how often these unusual moves led to large price swings. When tracked in real time with an options trading application, it can give you an early signal before the market makes a sharp move.
Limitations You Should Know
While historical price charts are very helpful, they are not perfect. Some important points to keep in mind are:
- Always remember that the future performance of any stock is not dependent on its past performance. Any major event in the market can also lead to changes in the options.
- There is no guarantee that the patterns will always be correct. They can be misleading and may cause harm to you as well. So, don’t rely solely on the patterns; consider other factors as well.
- New buyers can get lost if they have too much knowledge. Stick to a few simple tools at first, like trend lines, moving averages, or numbers. As you get better, you can add more.
Conclusion
If you want to increase your knowledge in trading, then you should first make your command of historical price charts. These charts will tell you how a particular stock performed in the past, and whether it will be right to make a USP in the future or not.
You may make better trading judgments by using charts together with your knowledge of implied volatility and atypical options flow.
If you want to learn how to trade options, it’s a good idea to start with previous data. This way, you can improve your abilities without putting your money at risk.